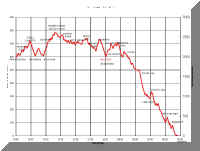
During the race I wore my Suunto wrist computer, which includes an altimeter. I set the altimeter log to record the elevation every minute. I entered the data form the log into a spreadsheet an plotted the elevations versus time. Then I entered the place names as labels from the official elevation chart given out on the race map.
It's important to note that my elevation is plotted against time, whereas the official chart is plotted against distance. The difference is that I go up slower than I go down, so the uphills appear to take longer, therefore less steep, than they actually are. And the downhills appear more steep on my chart than they are on Earth.
Also, I plotted my chart with time running from right to left to match the official elevation chart. So going from right to left takes me from Durban to Pietermaritzburg.
My watch also records total elevation ascent and descent during the log. The total ascent recorded was 5430 feet, or 1655 metres. The total descent recorded was 3450 feet, or 1052 metres, leaving a net ascent of 1980 feet or 604 metres. Since I set the elevation calibration to exactly sea level (0) at the race start, all values are probably off by whatever the elevation there on West Street in Durban actually is - I'd guess about 50 feet.
